Routeview Map Layers
This section describes the various map layers available in Routeview. You can access the layers from the Map Layers tool on the right hand side of the application.
The mapping for Routeview is divided into Basemaps and Overlays.
Basemaps
Basemaps are mapping layers which sit in the background and offer a spatial context to the Overlays which are more specific to Network Rail’s operations.
Only one base map can be selected at a time. The are sourced from other on-line sources of mapping data such as Google or Bing Mapping (from Microsoft). If you have used Google Maps, Google Earth, or Bing Maps you will know that their imagery can be a few years out of date so these Basemaps should be used as guides only. The oblique images are much more recent (though there is a range of dates typically available for a given location).
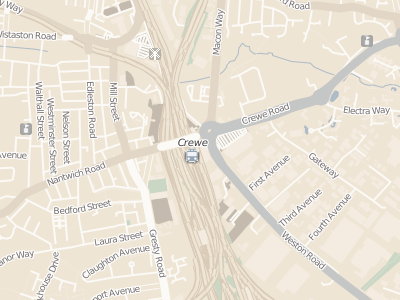
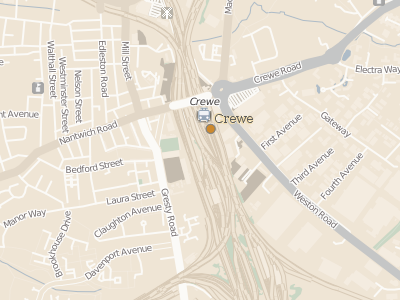
Map
Shows a Street Mapping view with roads, buildings, rivers etc clearly visible and labelled. Useful for general orientation and reporting where such a simplified backdrop makes for clearer map displays.
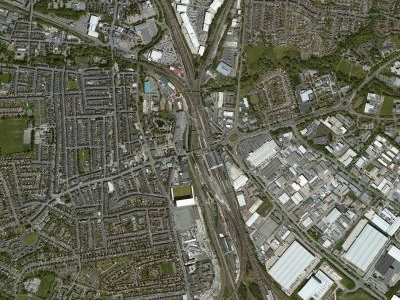
Satellite
Shows a global image mosaic of high resolution satellite imagery. Great when zooming into detail and looking at features as you may see them on the ground. Not as up-to-date at the oblique imagery stored in Routeview, but a good basis for searching for detailed locations
Overlays
More than one Overlay can be displayed at a time. They also come from a variety of sources, some hosted directly within Network Rail, and some hosted within Routeview. Overlays are more intelligent than Basemaps, so you can use the Map Information Tool to query their attributes.
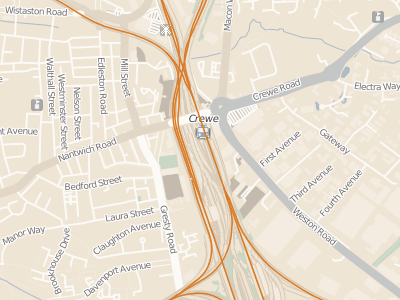
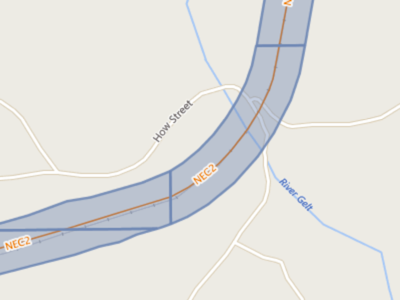
Tracks
Orange lines represent the current Network Rail track centrelines
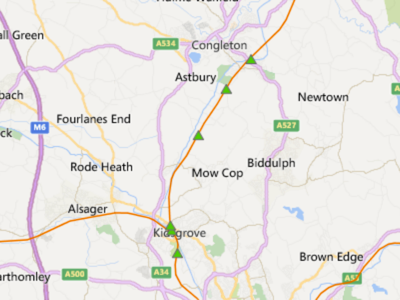
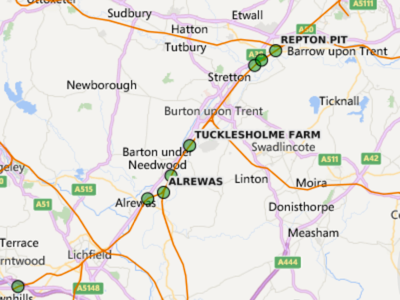
Access Points
A Green Triangle appears on the map at the location of each photo taken of an Access Point. It may not be a complete set of Access Points but will continue to be updated by the Airops team
Stations
Point locations of Network Rail stations
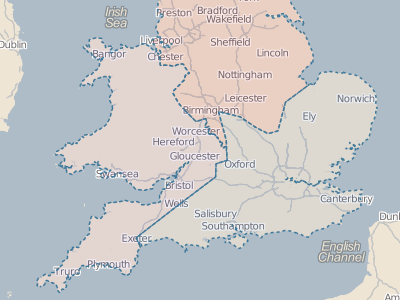
Route Boundaries
Boundaries of Network Rail Routes
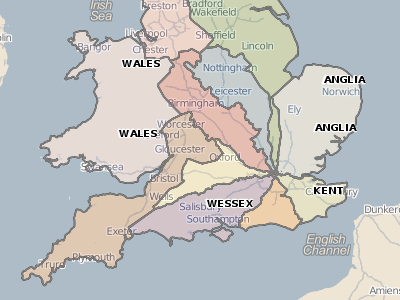
Air Ops Regions
Boundaries of the NR Air Operations Regions. Each colour represents a different region. Labels are region identifiers
Quarry Sites
250 Surface Mining Sites for which specific Geotech imagery has been taken – Survey Date Spring 2014
Telecoms Sites
Sites along the railways with telecoms equipment. Not just masts, but other equipment which may not be visible on the photographs. To avoid clutter, the labels only appear as you zoom in

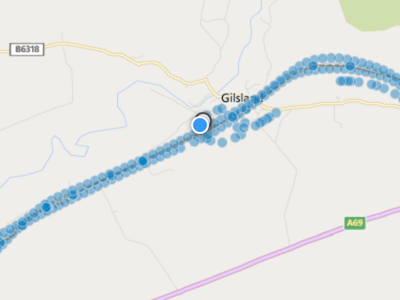
Photo Coverage
A layer of dots showing where we have a photograph. A summary is displayed initially but the details are shown as you zoom into your area of interest. The blue dots will correspond to the dots highlighted by the Spotlight circle as you move the cursor
LIDAR
Where LIDAR data has been collected, its coverage will be displayed as a series of polygons. Use the link in the Feature Information Tool to view the linked LIDAR point cloud